General info
To launch DiversityAnalyzer, type:
./diversity_analyzer.py -i INPUT_FILE -o OUTPUT_DIRECTORY -l LOCUS
- INPUT_FILE: input sequences of adaptive immune receptors in FASTA/FASTQ format;
- OUTPUT_DIR: output directory. Please note that DiversityAnalyzer checks the existence of OUTPUT_DIR, removes it if it exists, and creates an empty directory with name OUTPUT_DIR. So, we recommend not to specify an existing directory as OUTPUT_DIR!
- LOCUS: name of IG / TR locus that will be used for alignment. Possible values: ALL / IG / IGH / IGK / IGL / TR / TRA / TRB / TRG / TRD.
Optional parameters
| Description | Option | Values |
| Organism | --org ORGANISM |
human / mouse / rat / rabbit / rhesus-monkey / cattle. Default value is human. |
| Number of parallel threads | -t / --threads INT |
Default value is 16. |
| Skip visualization | --skip-plots |
By default, DiversityVisualizer visualizes statistics of input sequences. Note that this step might be time-consuming for large input libraries. |
Output
Diversity Analyzer performs V / J, CDR, and SHM labelings of input sequences; computes their diversity characteristics; computes nucleotide and amino acid substitutions; visualizes computed statistics and reports summary in user-friendly HTML format.
Output details
- Summary report
- VJ labeling output
- CDR labeling output
- SHM labeling output
- Diversity statistics
- Nucleotide and amino acid substitutions
- Summary annotation report
1. Summary report
Diversity Analyzer compiles a report in TSV format including basic diversity characteristics of input sequences. For each input sequence, report contains information about:
- Chain type: IGH / IGK / IGL / TRA / TRB / TRG / TRD.
- V and J hits. Gene names are consistent with IMGT database.
- Amino acid sequence.
- Information about productiveness: presence of stop codon (1 or 0); in-frame (1 or 0); productive (1 or 0).
- Positions of CDR1, CDR2, and CDR3. Note that all positions are inclusive.
2. VJ labeling output
Diversity Analyzer launches VJ Finder (fast and accurate aligner of Rep-seq reads) for finding V and J hits of input sequences. Based on computed VJ labeling, DiversityAnalyzer reports heatmap showing VJ usage:
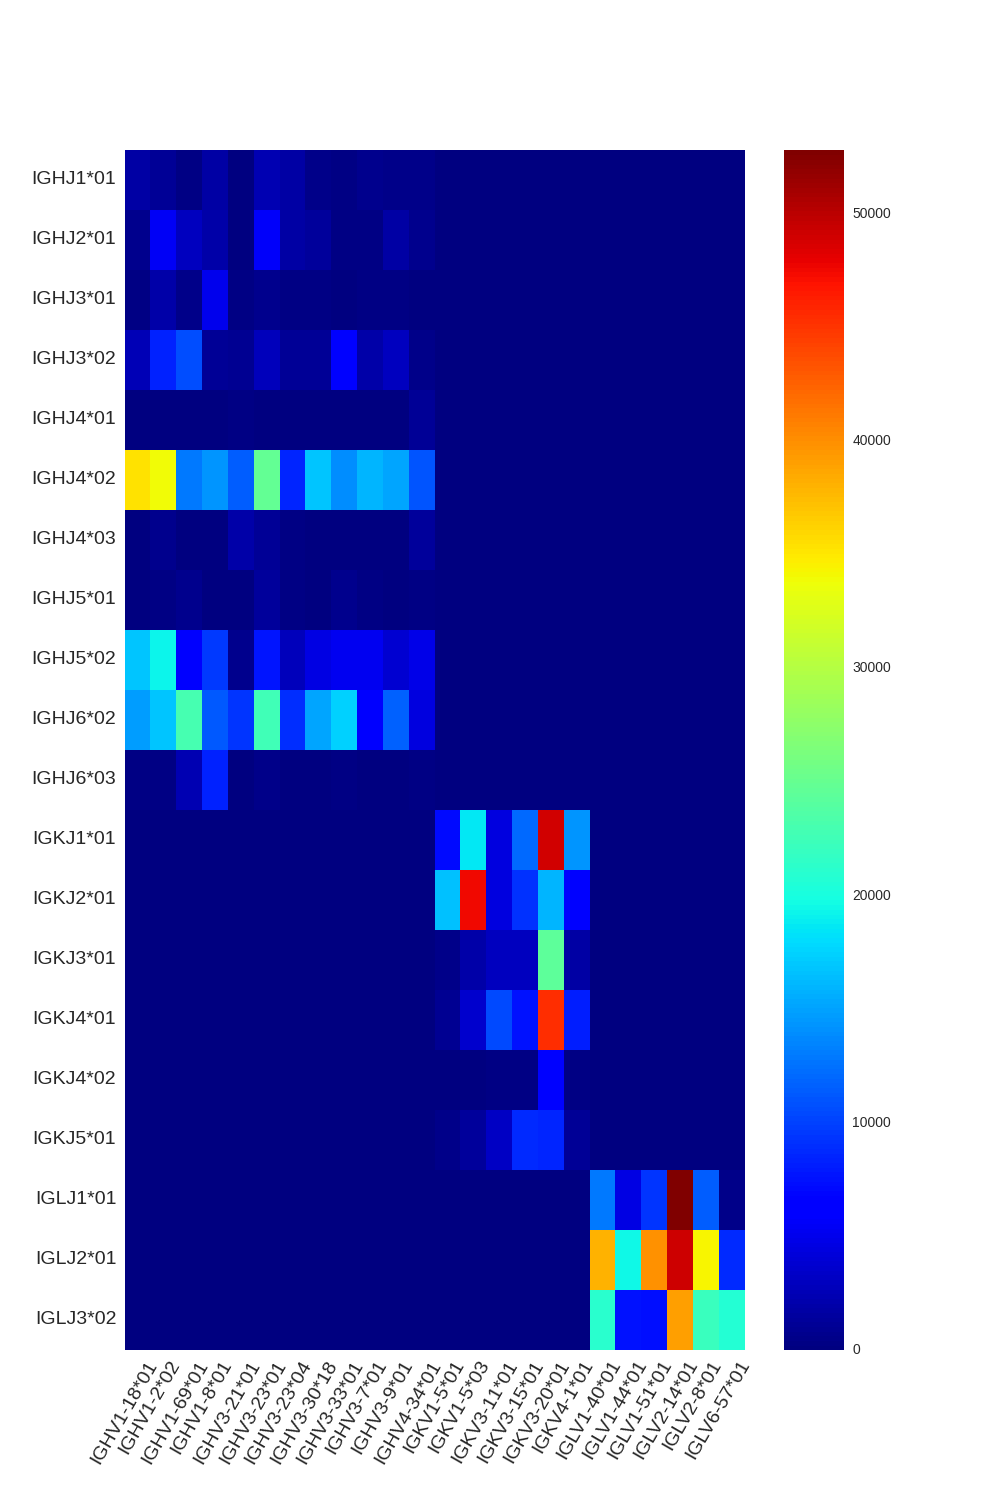
DiversityAnalyzer also computes usages of V and J genes in input receptor sequences. Note that allelic variations are collapsed for usage computation. E.g., both IGHV1-18*01 and IGHV1-18*02 will contribute to usage of IGHV1-18.
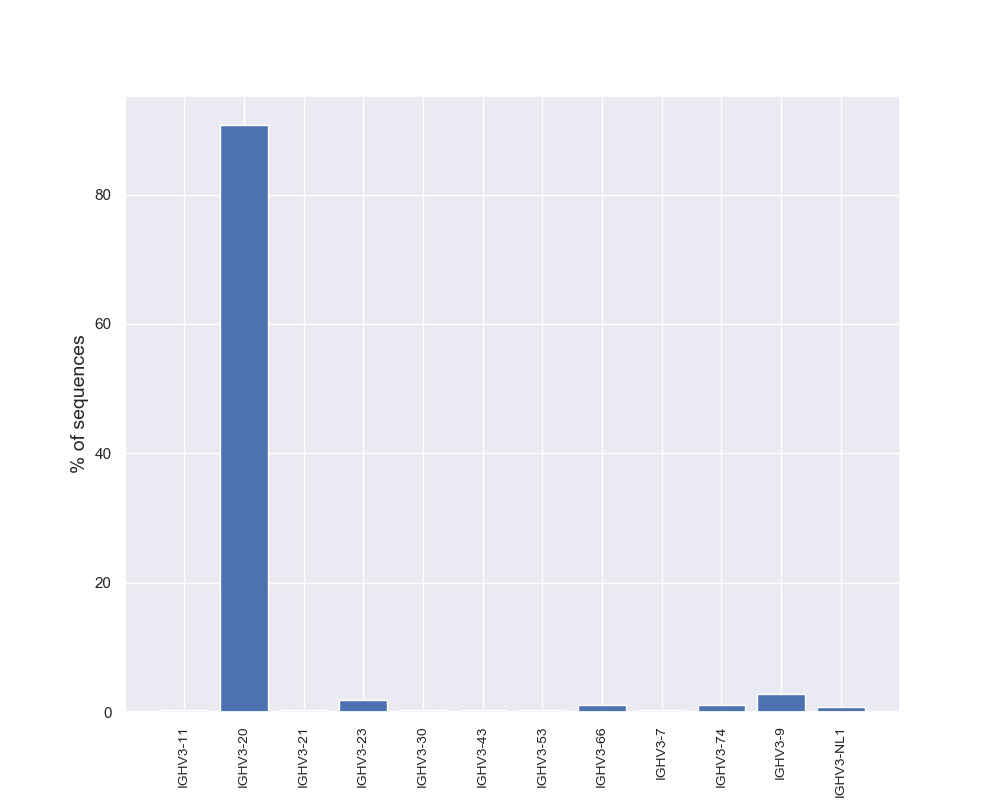 Click for preview |
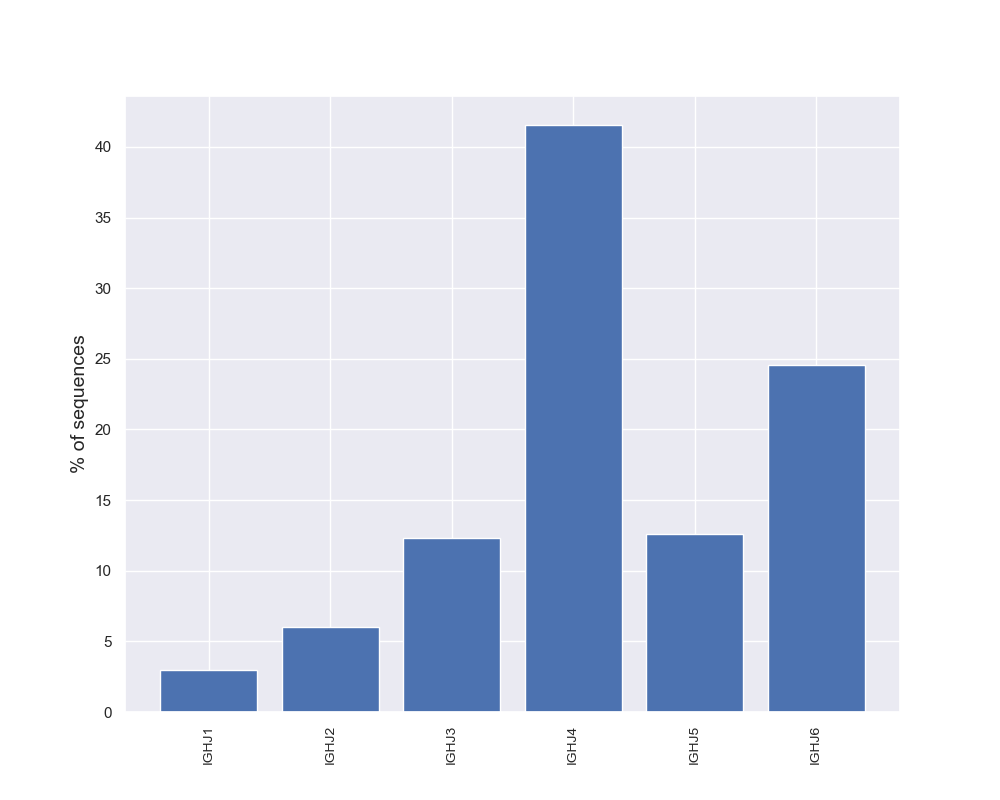 Click for preview |
DiversityAnalyzer also reports computed V and J usages in TXT files:
Gene_name Multiplicity Frequency
|
|
2.1. V alignments
Diversity Analyzer reports all computed V alignments in FASTA file. Each alignment is presented as a pair of gapped sequences of equal length. Code below shows an example of V alignments in FASTA format for a single read-gene pair:
        >INDEX:1|READ:1_merged_read|START_POS:0|END_POS:295
        GAGGTGCAGTTGGTAGAGTCTGGGGGAGGATTGGTCCAGCCGGGGGGGTCCCTGAGACTCTCCTGTGCAGCCTCTGGATTCACCTTTAGTAGTTATTGGATGAGCTGGGTCC
        GCCAGGCTCCAGGGAAGGGGCTGGAGTGGGTGGCCAACATAAAGCAAGATGAAAGTGAGAAATATTATGTGGACTCTGTGAAGGGCCGATTCACCATCTCCAGAGACAACGC
        CAAGAAGTCACTGTCTCTGCGAACGAACAGGCTGAGAGCCGAGTACATGGCTGTGTATTACTGTGCGAGTAC


        >INDEX:1|GENE:IGHV3-7*01|START_POS:0|END_POS:295|CHAIN_TYPE:IGH
        GAGGTGCAGCTGGTGGAGTCTGGGGGAGGCTTGGTCCAGCCTGGGGGGTCCCTGAGACTCTCCTGTGCAGCCTCTGGATTCACCTTTAGTAGCTATTGGATGAGCTGGGTCC
        GCCAGGCTCCAGGGAAGGGGCTGGAGTGGGTGGCCAACATAAAGCAAGATGGAAGTGAGAAATACTATGTGGACTCTGTGAAGGGCCGATTCACCATCTCCAGAGACAACGC
        CAAGAACTCACTGTATCTGCAAATGAACAGCCTGAGAGCCGAGGACACGGCTGTGTATTACTGTGCGAGAGA
3. CDR labeling output
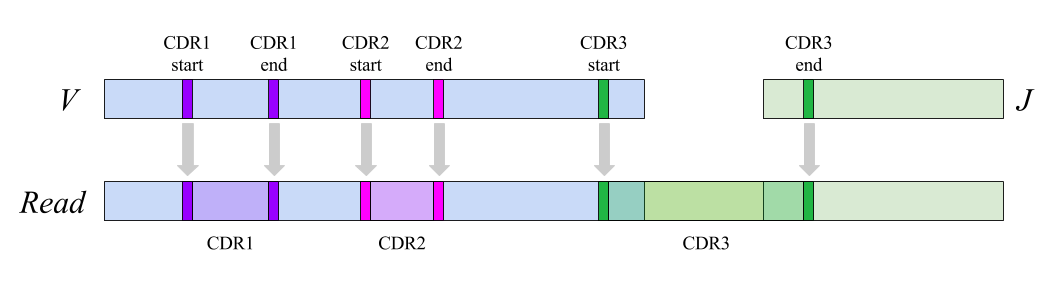
Diversity Analyzer aligns input sequences against V and J segments from the IMGT database with known positions of CDRs.
Using alignment, positions of germline CDRs are converted into positions of receptor sequences:
 IMGT and
Kabat notations are available for labeling.
Diversity Analyzer also reports computed CDR1s, CDR2s, and CDR3s in FASTA format.
IMGT and
Kabat notations are available for labeling.
Diversity Analyzer also reports computed CDR1s, CDR2s, and CDR3s in FASTA format.
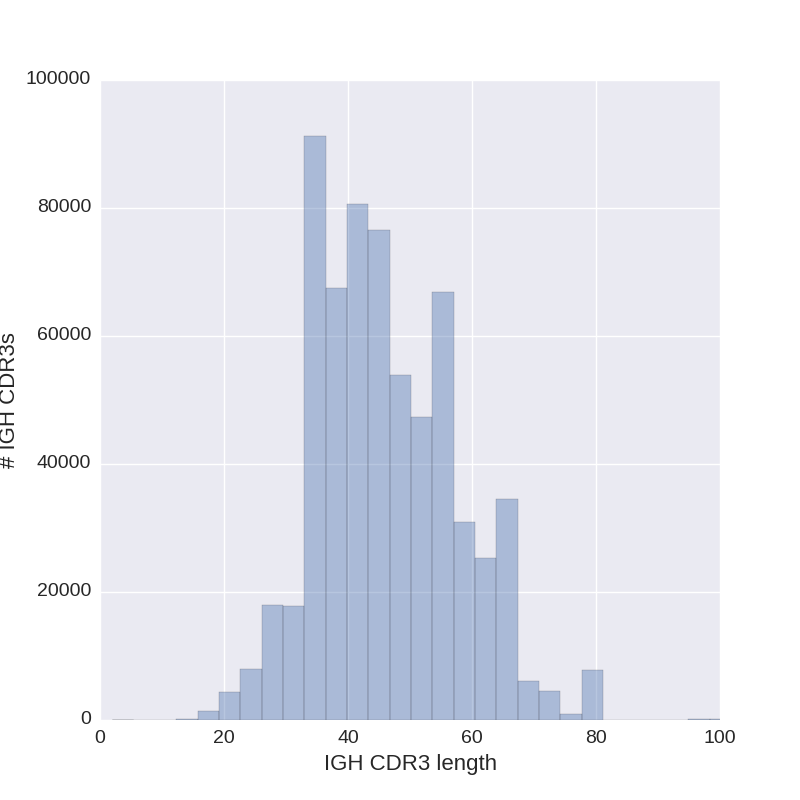
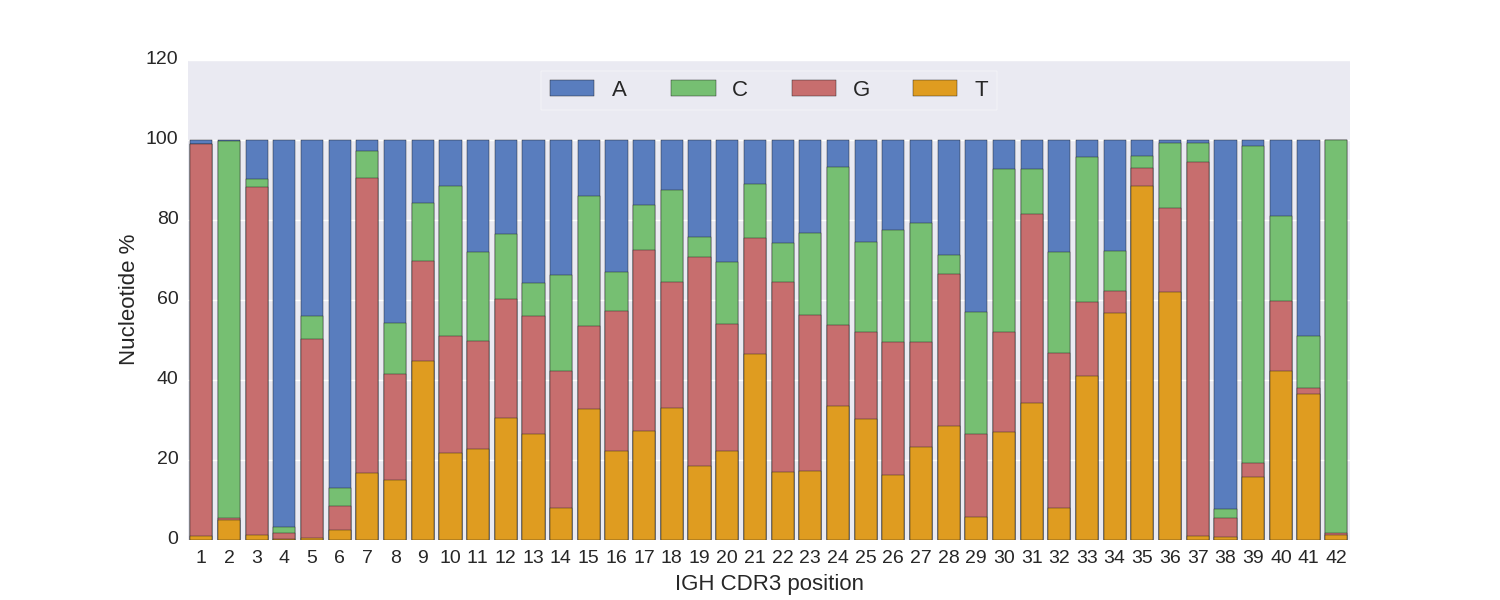
3.1. CDR statistics
If a chain is presented by at least 100 input sequences, Diversity Analyzer computes characteristics of its CDRs:
|
Upper right: distribution of CDR3 lengths.
Diversity Analyzer also selects length of CDR3s that presented by the largest number of CDR3s.
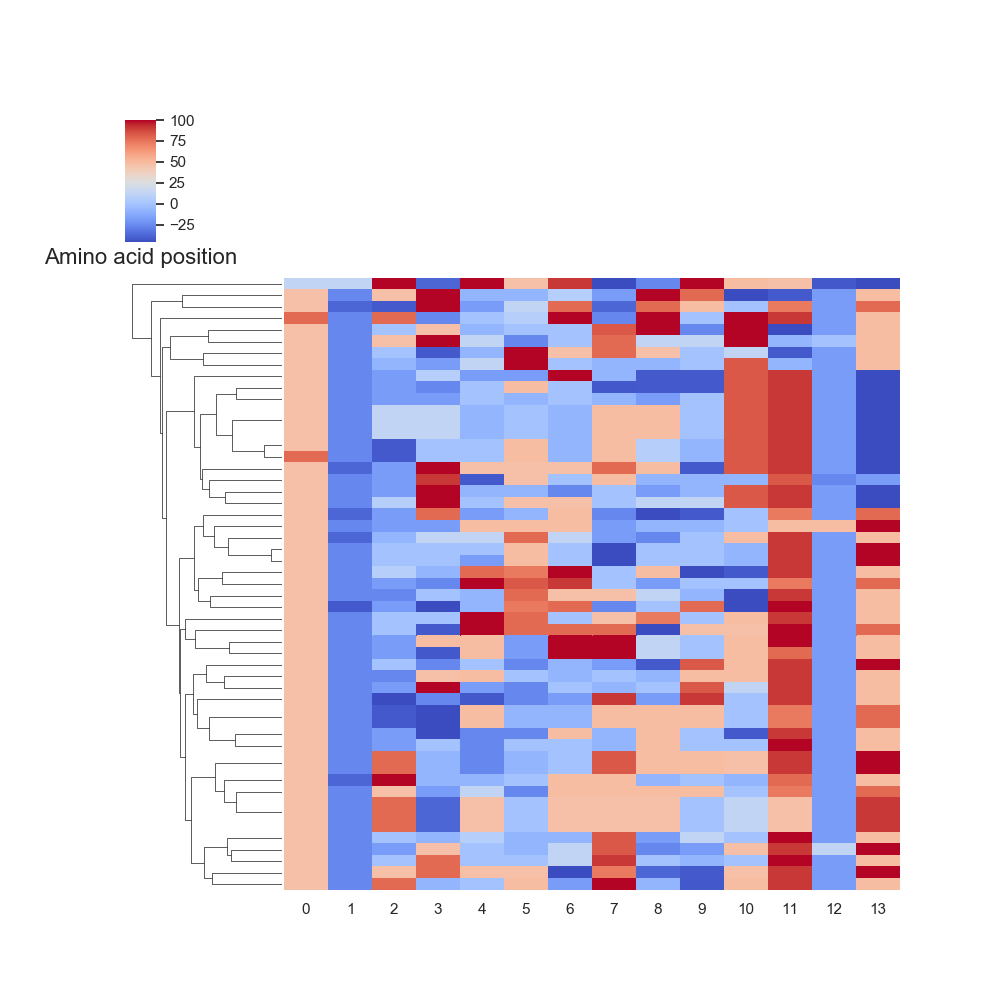
For CDR3s of this length, nucleotide (lower left) and amino acid (lower right) content are visualized.
Amino acids are colored according to their hydrophobicity.
Hydrophobic amino acids are colored in red, hydrophilic amino acids are colored in blue,
neutral amino acids are colored in pale colors.
|
|
 Click for preview
 Click for preview
 Click for preview
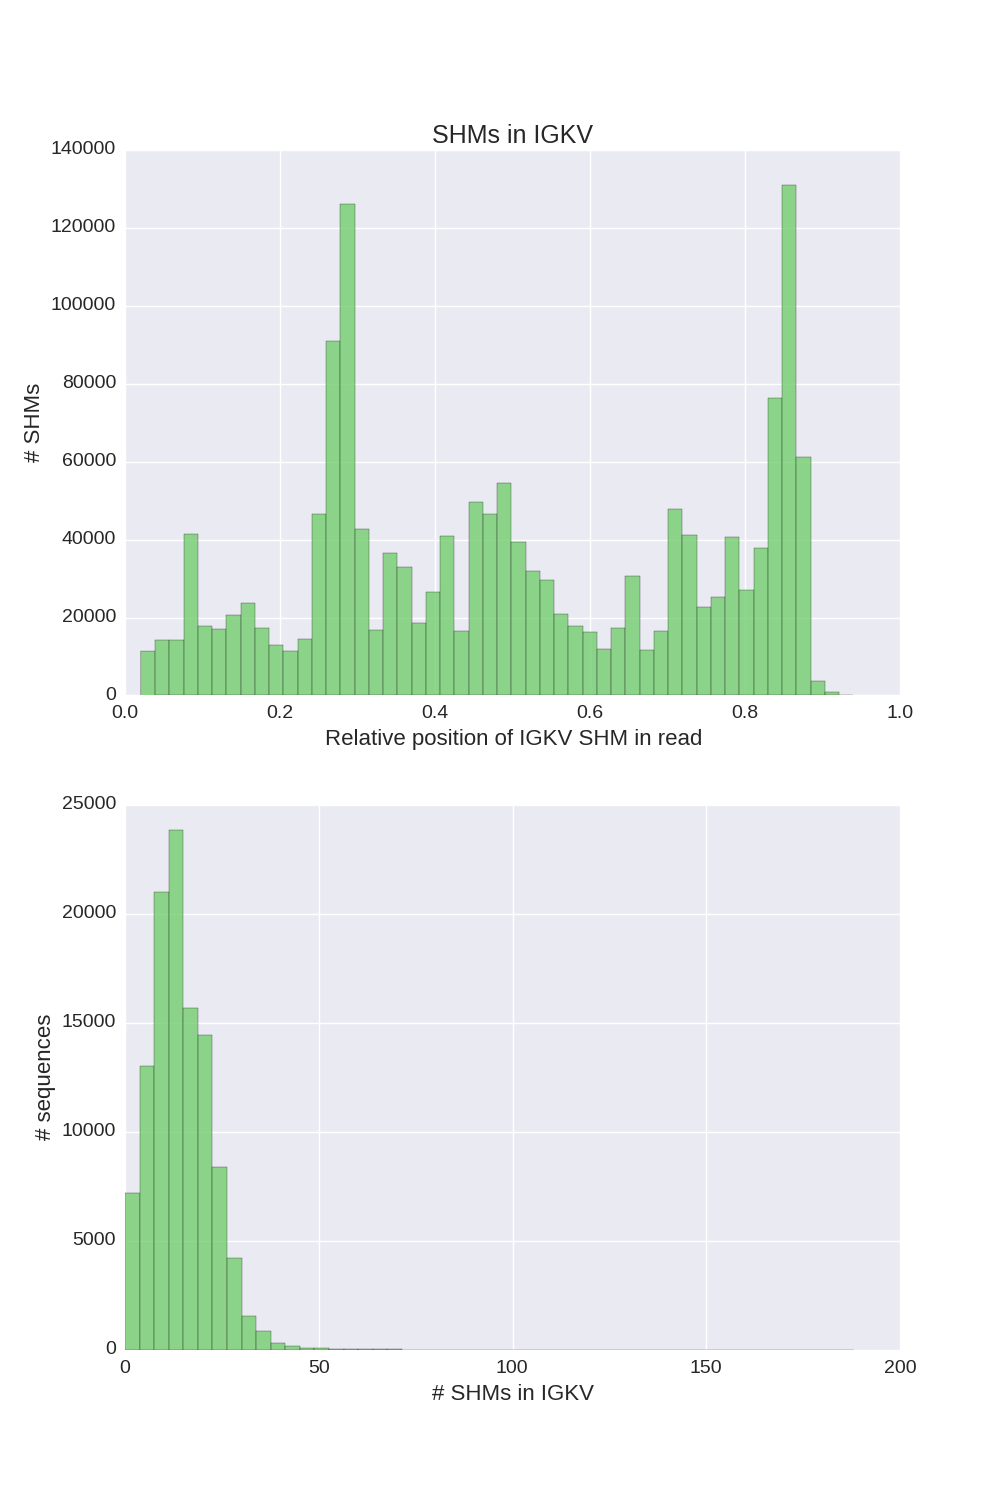
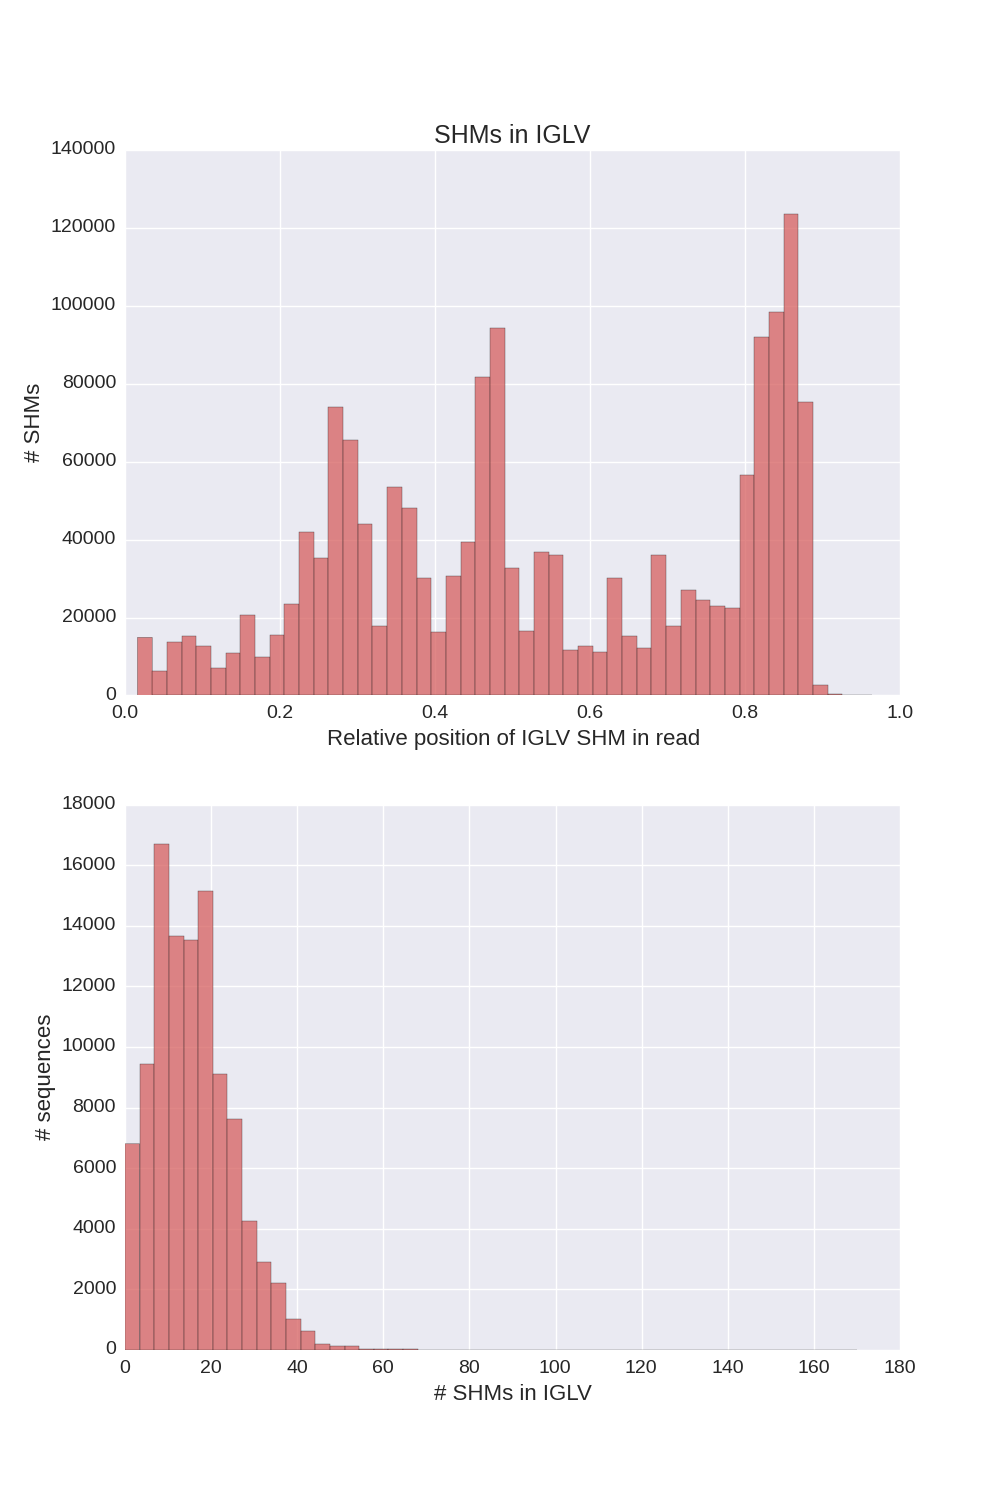
4. SHM labeling output
For each input sequence, Diversity Analyzer computes SHMs and compiles their characteristics in TSV format. For each SHM, the following characteristics are reported:
- SHM type: substitution (S) / insertion (I) / deletion (D).
- Positions on sequence and germline gene.
- Nucleotides of sequence and germline gene at the position of SHM. In case of indel, SHM is denoted as '–'.
- Amino acids of sequence and germline gene at the position of SHM.
- Indicator of SHM synonymy: 1 or 0.
- Indicator whether SHM leads to occurrence of stop codon: 1 or 0.

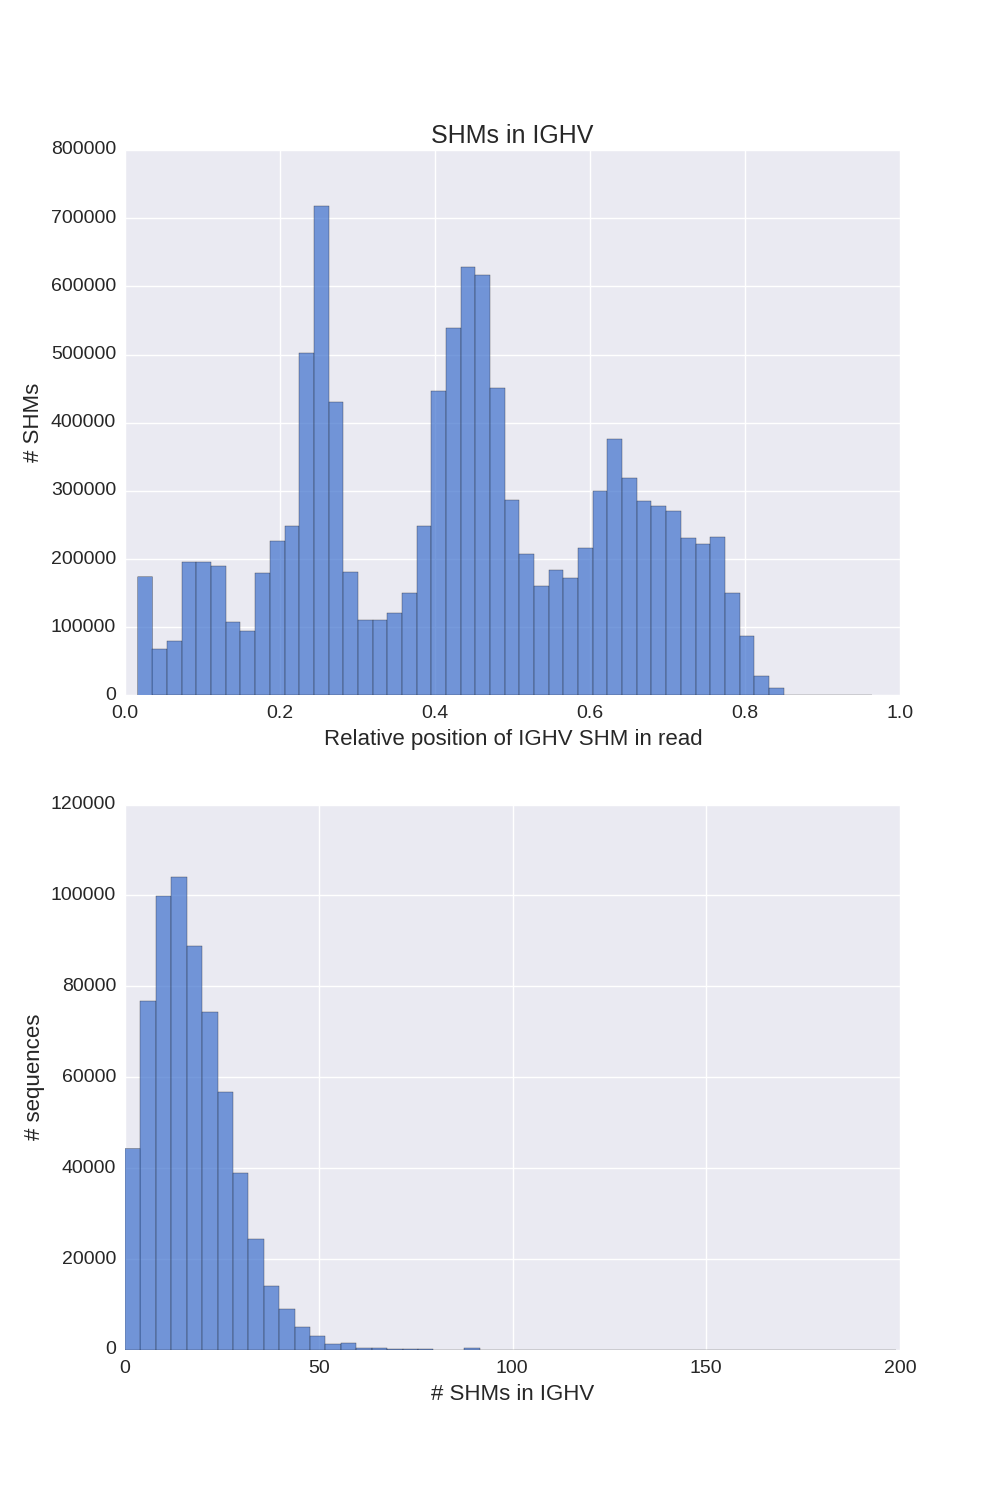
4.1 SHM plots
If a chain presented in input sequences, Diversity Analyzer reports plots for SHMs lying in V segments of sequences of this chain:
| IGH | IGK | IGL |
 Click for preview
|
 Click for preview
|
 Click for preview
|
Diversity Analyzer reports characteristics of special SHMs (indels, synonymous) lying in V segments:
| Distribution of indel SHMs lengths |
 Click for preview |
5. Diversity statistics
For each computed CDR3, Diversity Analyzer computes its abundance as a number of input sequences with this CDR3. For a collection of CDR3 abundances, Diversity Analyzer applies methods of population analysis for computation of diversity characteristics of input sequences.
| Simpson index (SI) | Clonal Simpson index (CSI) |
| SI is computed as a probability of two randomly selected CDR3s to be equal. | CSI is an approximation of a probability of two randomly selected CDR3s to belong to the same clonal lineage. |
A ratio of CSI to SI demonstrates relation between clonally related receptor sequences to random sequences. The higher value of CSI / SI, the higher clonal diversity of an input dataset. Example of the comparative analysis of three datasets with various properties is given below:
| PBMCs | ASCs (negative to influenza HA) | ASCs (positive to influenza HA) |
| 0-th day of vaccination | 7-th day of vaccination | 7-th day of vaccination |
| SRR3620098 | SRR3620075 | SRR3620074 |
| Low clonal diversity | Medium clonal diversity | High clonal diversity |
| CSI / SI = 1.36 | CSI / SI = 7.15 | CSI / SI = 11.96 |
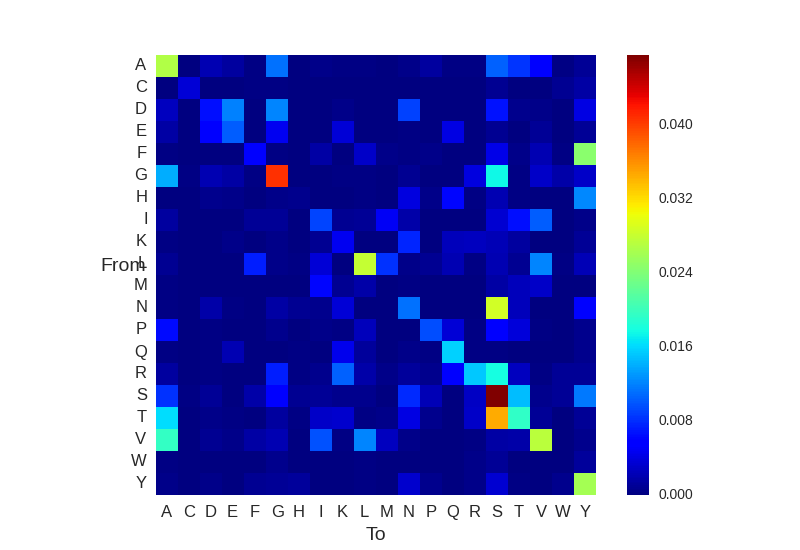
6. Amino acid and nucleotide substitutions
Diversity Analyzer reports and visualizes matrices of nucleotide and amino acid substitutions:
 Click for preview
|
 Click for preview
|
7. Summary annotation report
Diversity Analyzer compiles all computed statistics and plots into a single report in HTML format. Example of such report can be found here (antibody repertoire from HIV-infected patient, 181 week of disease).
Citation and feedback
If you use DiversityAnalyzer in your research, please cite our paper: Shlemov A, Bankevich S, Bzikadze A, Turchaninova MA, Safonova Y, Pevzner PA. Reconstructing Antibody Repertoires from Error-Prone Immunosequencing Reads. J Immunol. 2017 Nov 1;199(9):3369-3380.
If you have any questions or troubles with running DiversityAnalyzer, please contact Yana Safonova. We also will be happy to hear your suggestions about improvement of our tools!